The state/status frame can be found near the bottom of any CLEO application
that attaches to an YGOR manager.  The
frame provides information on the health of a manager (its status) and what
the manager is currently doing (its state). The frame also contains three
indicators whose color show whether or not the screen is currently 'connected'
to a device. A timestamp, when appropriate, is included at the right of the
frame for one of the manager's samplers. The 'ticking' of the timestamp should
give you a sense of confidence that the connection to the manager is up and
working.
The
frame provides information on the health of a manager (its status) and what
the manager is currently doing (its state). The frame also contains three
indicators whose color show whether or not the screen is currently 'connected'
to a device. A timestamp, when appropriate, is included at the right of the
frame for one of the manager's samplers. The 'ticking' of the timestamp should
give you a sense of confidence that the connection to the manager is up and
working.
Status:
The Status widget provides a text description of the Status
(health) of a manager. The background of the widget will turn colors
depending upon the severity of problems with the device. Here's a list of
possible status values, the colors used, and a description of what the values
mean:
Manager Status
| Text |
Color |
Description |
| clear |
white |
The device has no problems. |
| Info |
light blue |
Indicates an expected event. |
| Notice |
cyan |
Unexpected events that are not reported at the more
severe levels. This level includes illegal actions by users. |
| Warning |
green-yellow |
Unexpected or possible problem-causing event which
requires more careful monitoring or investigation by the operator. |
| Error |
orange |
An event has occurred which requires a specific action by
the operator, such as notifying the contact engineer. |
| Fault |
orange-red |
An event which will cause the system to -- at least in
part -- generate bad observational data or prevents the completion of
actions. |
| Fatal |
red |
An unexpected and problem-causing event which requires
some action by telescope personnel, i.e., equipment or personnel are in
danger. |
| Unknown |
red |
The status cannot be determined by CLEO. |
The YGOR message window will show more detailed information whenever
the status is other than 'clear'.
State:
The State widget reports what the manager is currently doing. The
background of the widget will turn colors depending upon the state of the
device. Here's a list of possible state values, the colors used, and a
description of what the values mean:
Manager States
| Text |
Color |
Description |
| NotInService |
red |
The manager is not available (most likely because its
device has been removed for servicing). |
| Off |
red |
The manager is off (i.e., no one currently want to use
it). |
| Standby |
yellow |
The manager has been off and has just been turned on. |
| Ready |
white |
The normal, non-observing state of a device. |
| Activating |
cyan |
The manager is currently activating either because the
user has altered a parameter and maybe about to start an observation. |
| Committed |
yellow |
The manager is ready to start an observation at the
appropriate start time. |
| Running |
light green |
The manager is in the middle of an observation. |
| Stopping |
orange |
The manager has just finished an observation and will
soon be back to Ready. |
| Aborting |
red |
The manager received an abort command and will
immediately return to Ready. |
| NotConnected |
cyan |
The state cannot be determined by CLEO. |
| Simulated |
cyan |
This is a CLEO testing mode and should never be seen. |
Connection Indicators:
The three color indicators to the right of the State widget show
whether the connections to YGOR are up
(green) or down (red). The
three indicators contain letters to remind you what connections they
represent:
M : connection to the Manager.
A : connection to the Accessor
T : connection to the Transporter.
You should look at the YGOR
fundamentals documentation for more information on what these mean.
 Here's
an example of what the state/status frame will look like if CLEO cannot
connect to the application's manager. Note that even the time stamp will
indicate something is amiss.
Here's
an example of what the state/status frame will look like if CLEO cannot
connect to the application's manager. Note that even the time stamp will
indicate something is amiss.
State/Status Popup:
As a debugging tool, if you right double click the mouse anywhere 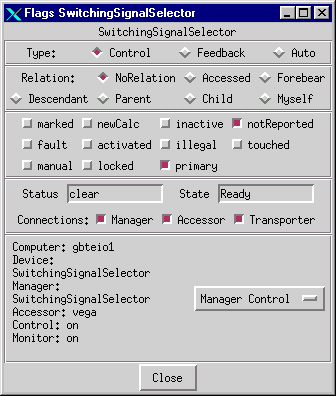 inside
a state/status frame, a popup window will appear that will tell you everything
CLEO knows about the manager. You'll need to understand the concepts behind an
YGOR manager to appreciate the information provided by the popup.
inside
a state/status frame, a popup window will appear that will tell you everything
CLEO knows about the manager. You'll need to understand the concepts behind an
YGOR manager to appreciate the information provided by the popup.
Note that we have repeated all of the information included in the
application's state/status frame. Included on the popup is a "Menu
Control" menu which will allow you to control the manager similar to what
you can do with the application's menu bar
Manager item.