High Frequency Weather Forecasts
Last updated: Thu, Jan 22, 18:00:00 UT
Larry Morgan and Ronald J Maddalena (Retired)
Green Bank Observatory, Green Bank, WV


Overview
of DSS Observing Efficiencies:
 The color coding in
the plot is similar to that used in the Overview
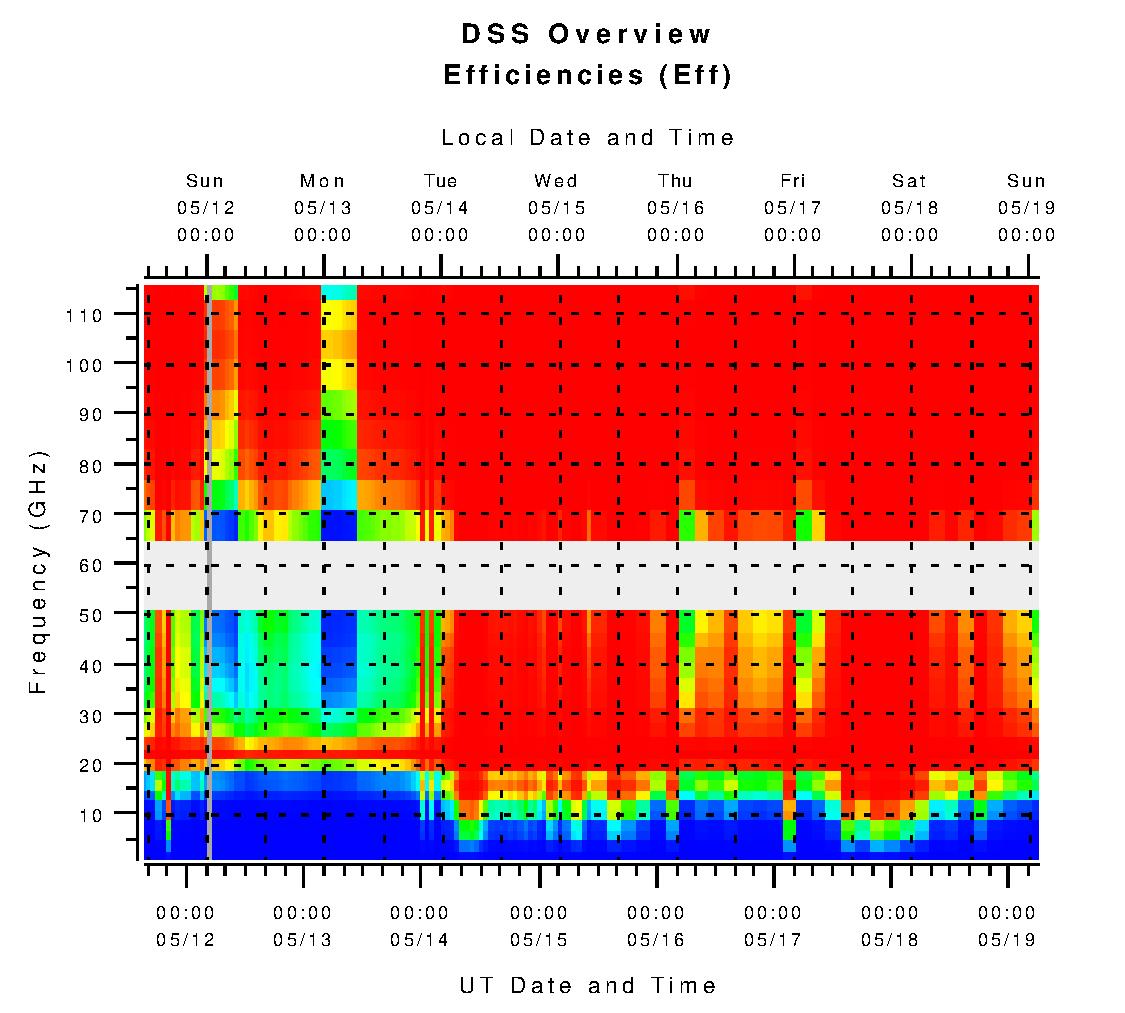
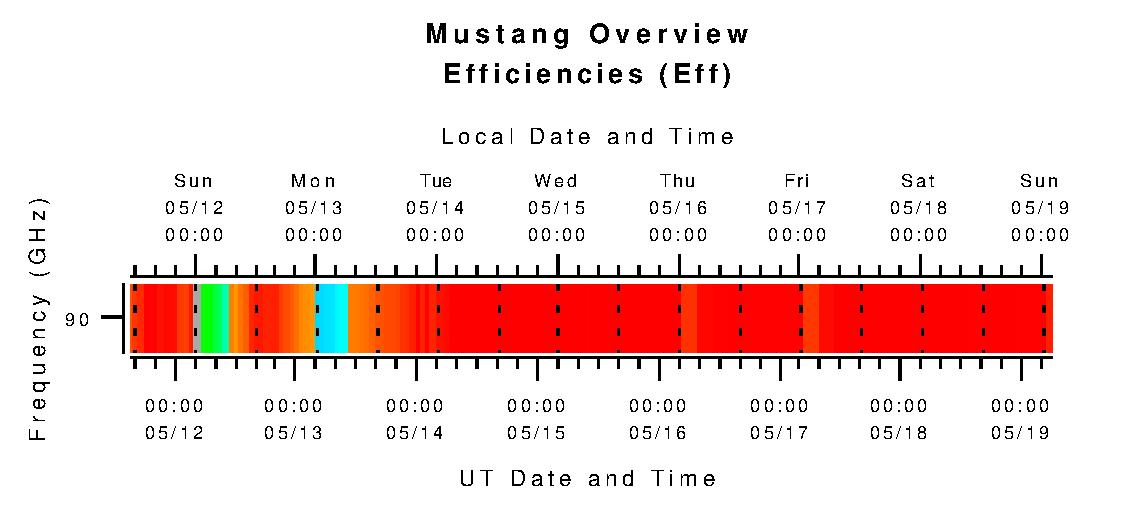
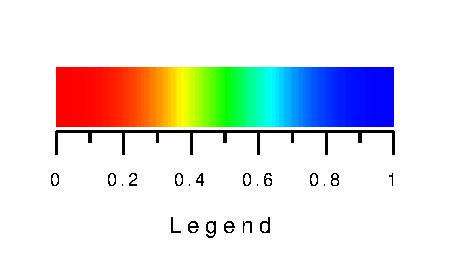
of DSS Observing Efficiencies except what is plotted here is H=eta instead of H=eta*leff/etamin. Green through blue
indicates times and frequencies
where the Dynamic Scheduling
System
(DSS) believes a project will be most productive. Yellows through red are
those frequencies and times when the DSS believes would be an
unproductive use of the telescope. A light blue background
indicates frequencies which are not yet covered by the DSS algorithms
or are times for
which there are no forecasted values. The blue vertical line
indicates the time when this plot
was last updated, usually within the last two hours. The DSS
algorithms apply to forecasted opacities for Hot Springs, VA only.
You may also want to take a look at:


 The color coding in
the plot is similar to that used in the Overview
of DSS Observing Efficiencies except what is plotted here is H=eta instead of H=eta*leff/etamin. Green through blue
indicates times and frequencies
where the Dynamic Scheduling
System
(DSS) believes a project will be most productive. Yellows through red are
those frequencies and times when the DSS believes would be an
unproductive use of the telescope. A light blue background
indicates frequencies which are not yet covered by the DSS algorithms
or are times for
which there are no forecasted values. The blue vertical line
indicates the time when this plot
was last updated, usually within the last two hours. The DSS
algorithms apply to forecasted opacities for Hot Springs, VA only.