 |
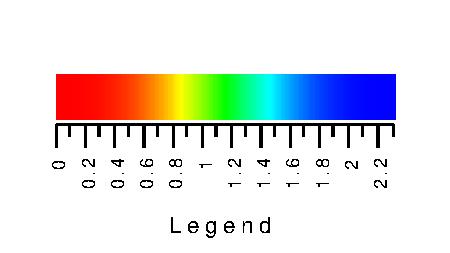
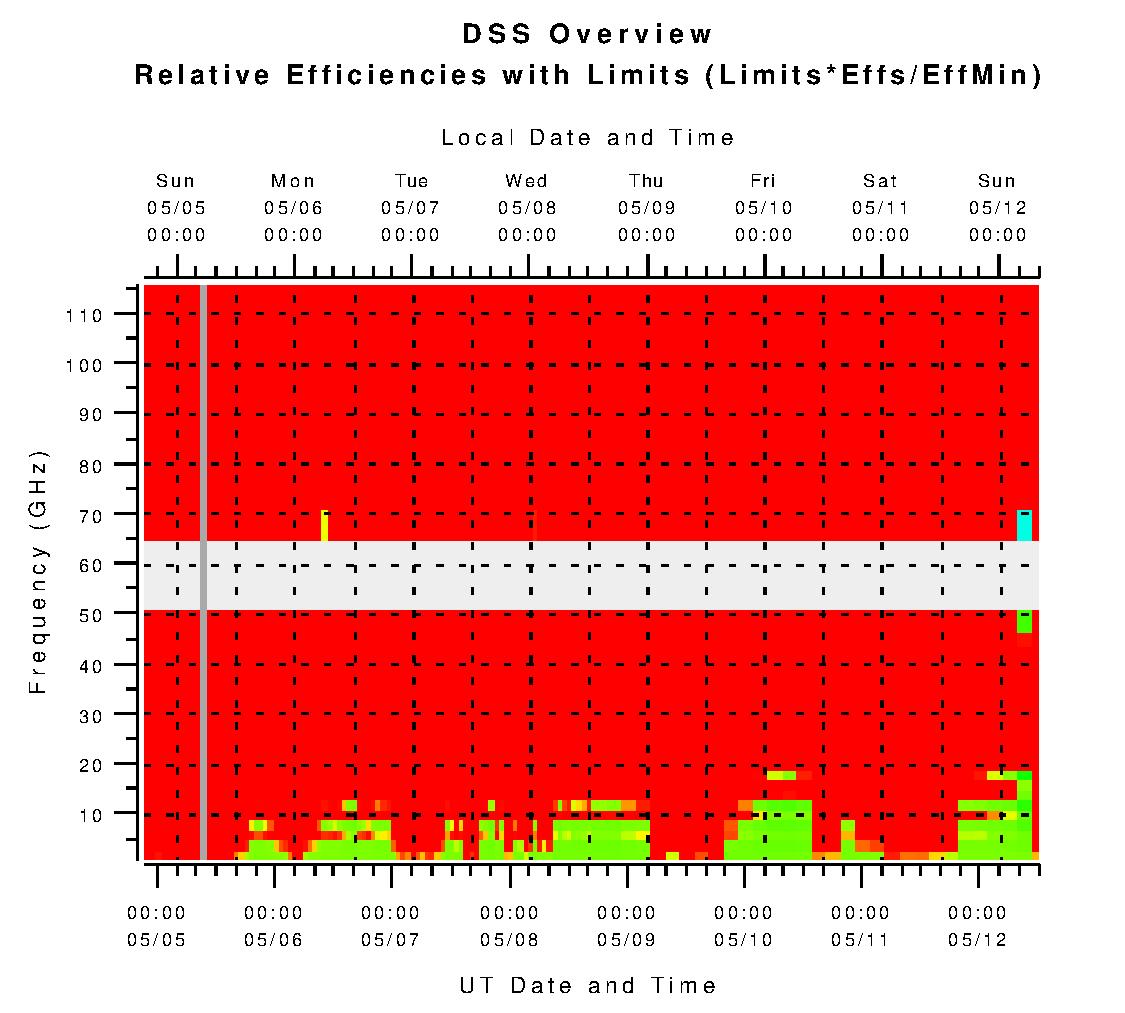
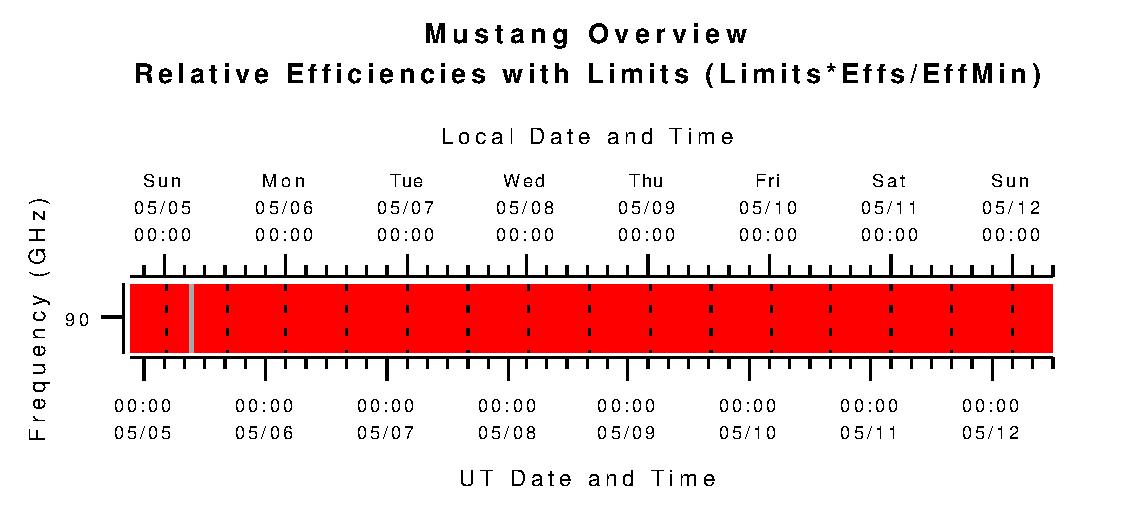
Explanation: The total score by which the DSS judges which projects will make the most efficient use of telescope time. |
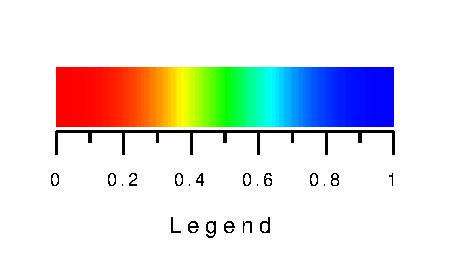 |
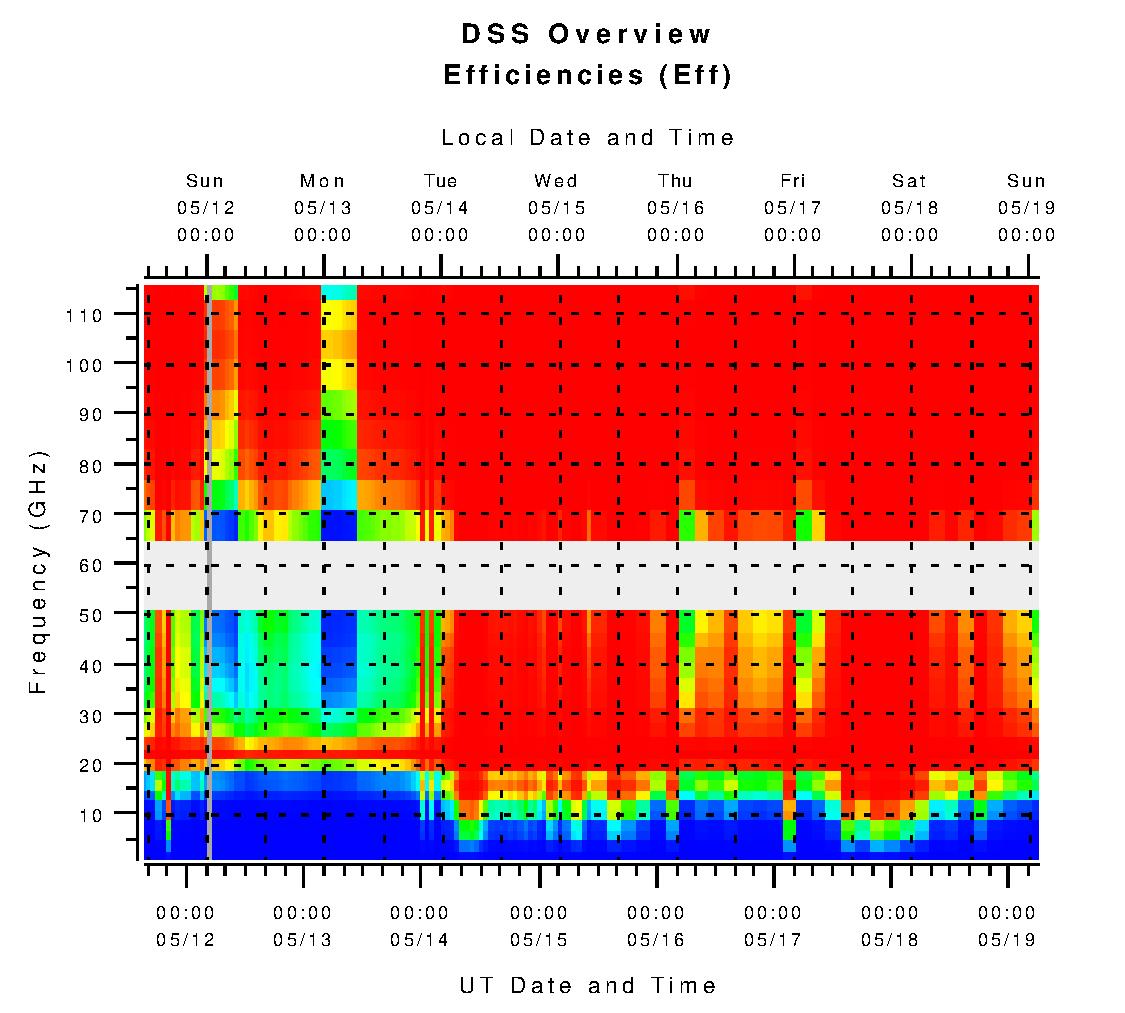
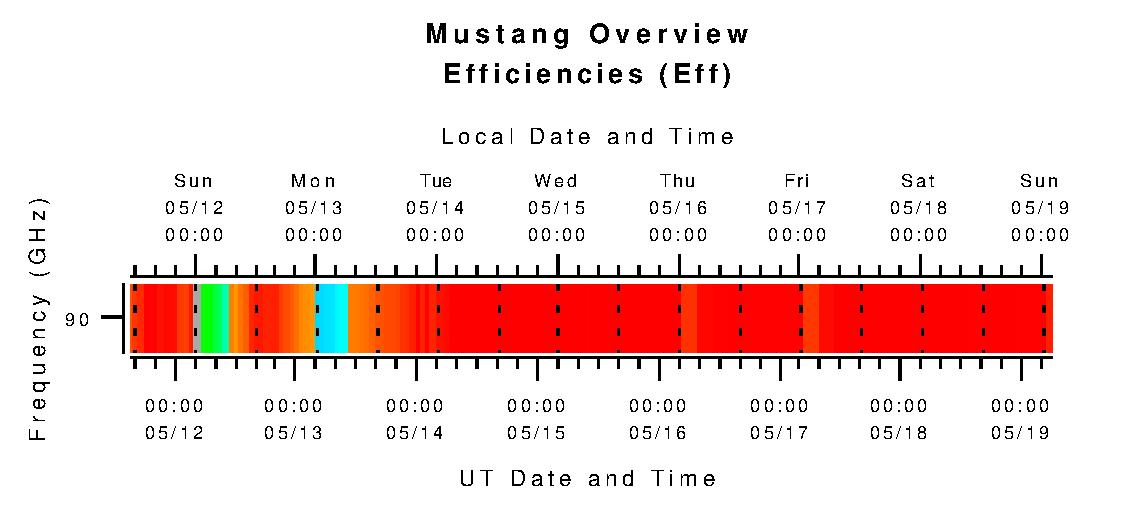
Explanation: Shows observing efficiency (Effs = EffAtm*EffTrack*EffSurf) without applying the DSS judgments for both the frequency-dependent stringency (EffMin) and the limits of when a project will become futile (LimitEff and LimitTrack). |
 |
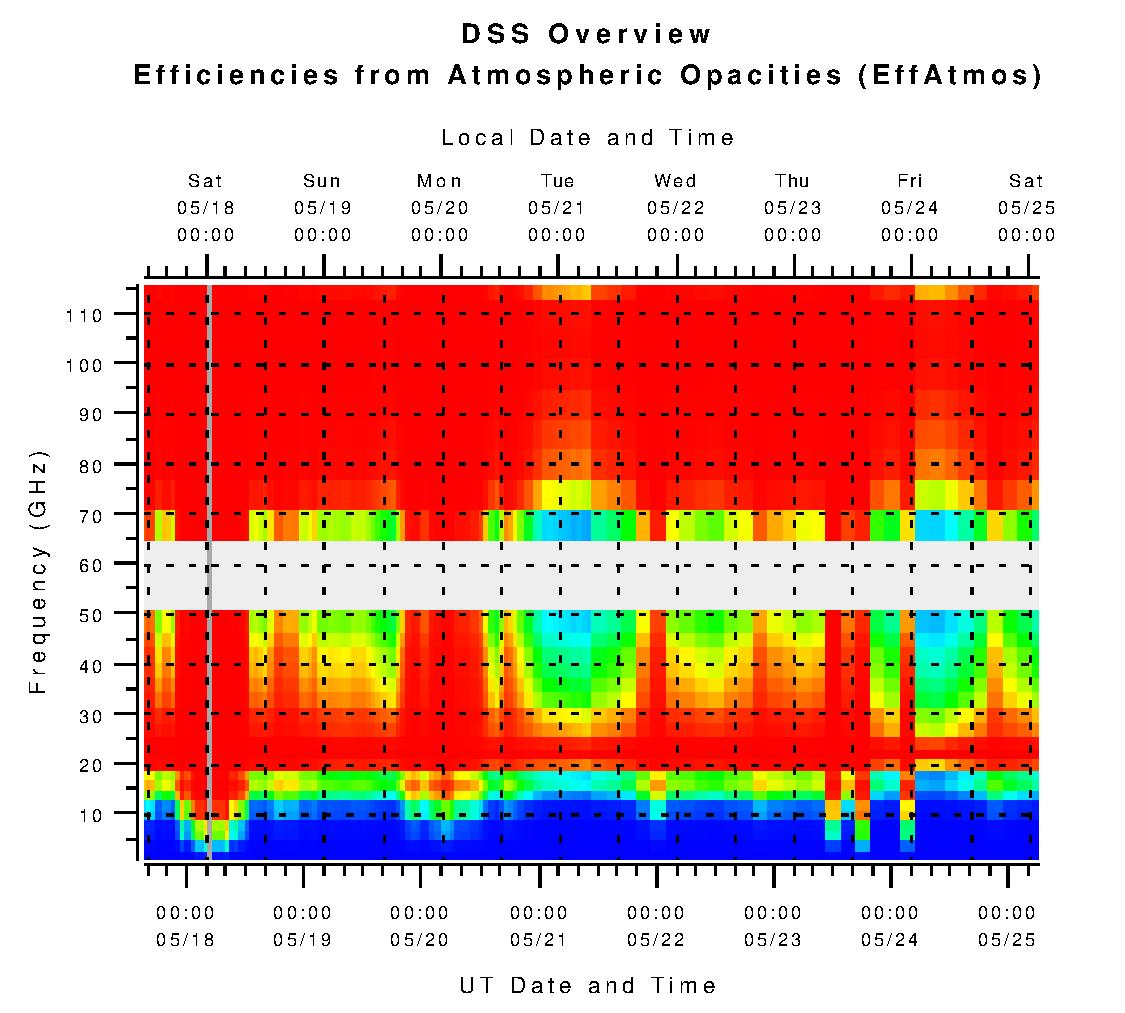
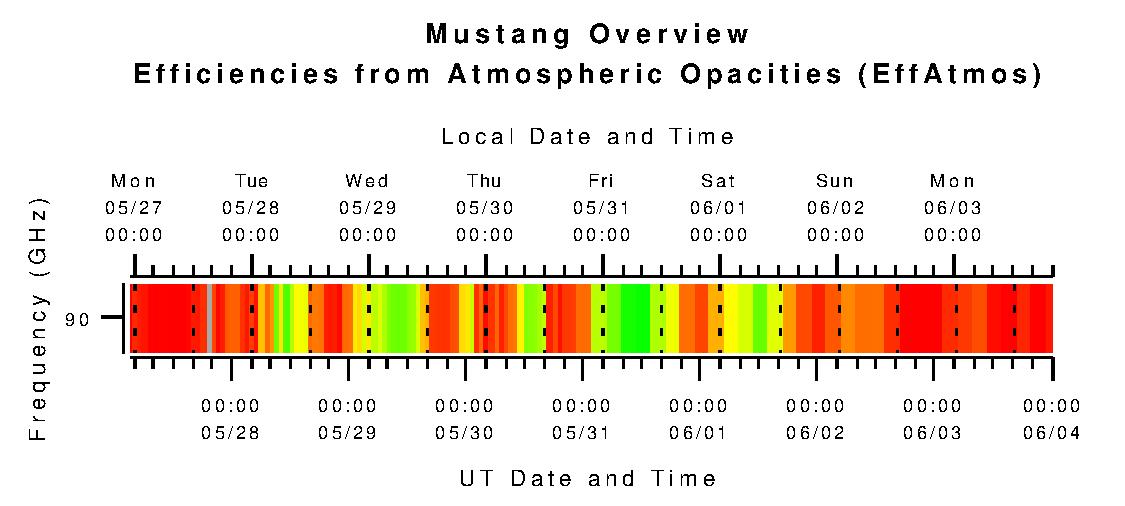
Explanation: Shows the degradation in the the part of efficiency that arises from the atmosphere, relative to the best possible conditions for Green Bank. |
 |
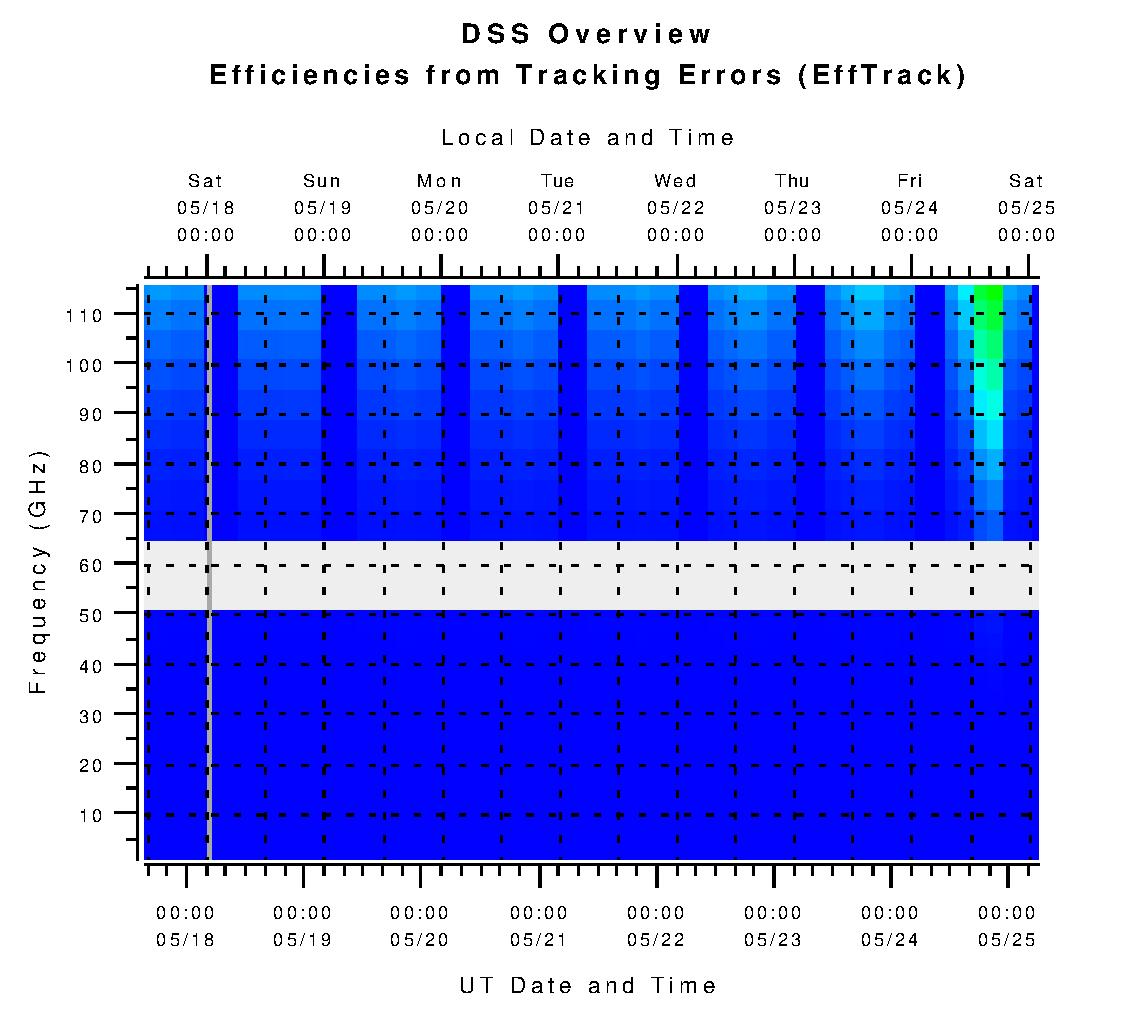
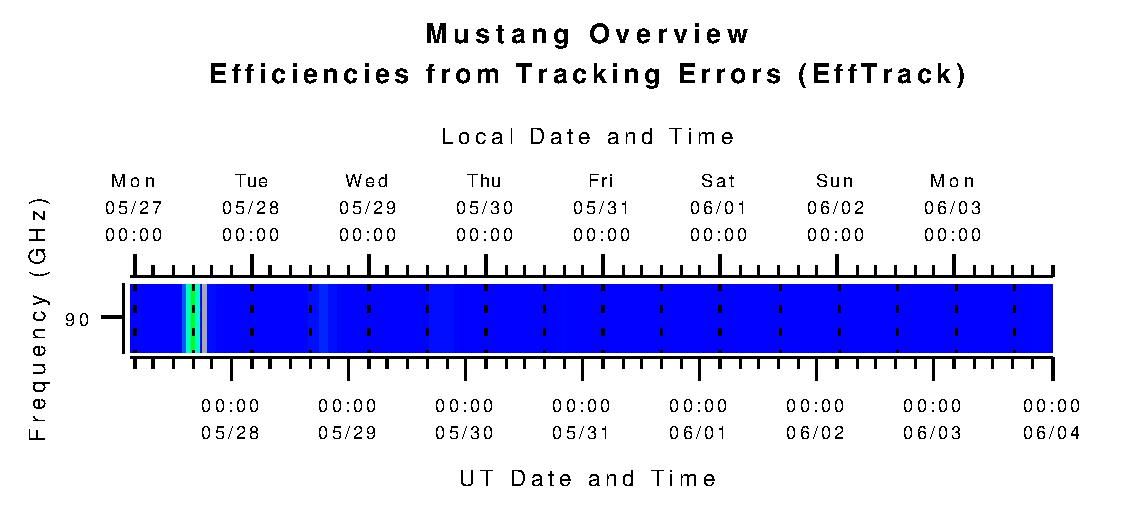
Explanation: Shows the degradation in the the part of efficiency that arises from tracking and pointing errors due to winds and due to poorer telescope pointing performance during daytime observing, relative to nighttime observing. |
 |
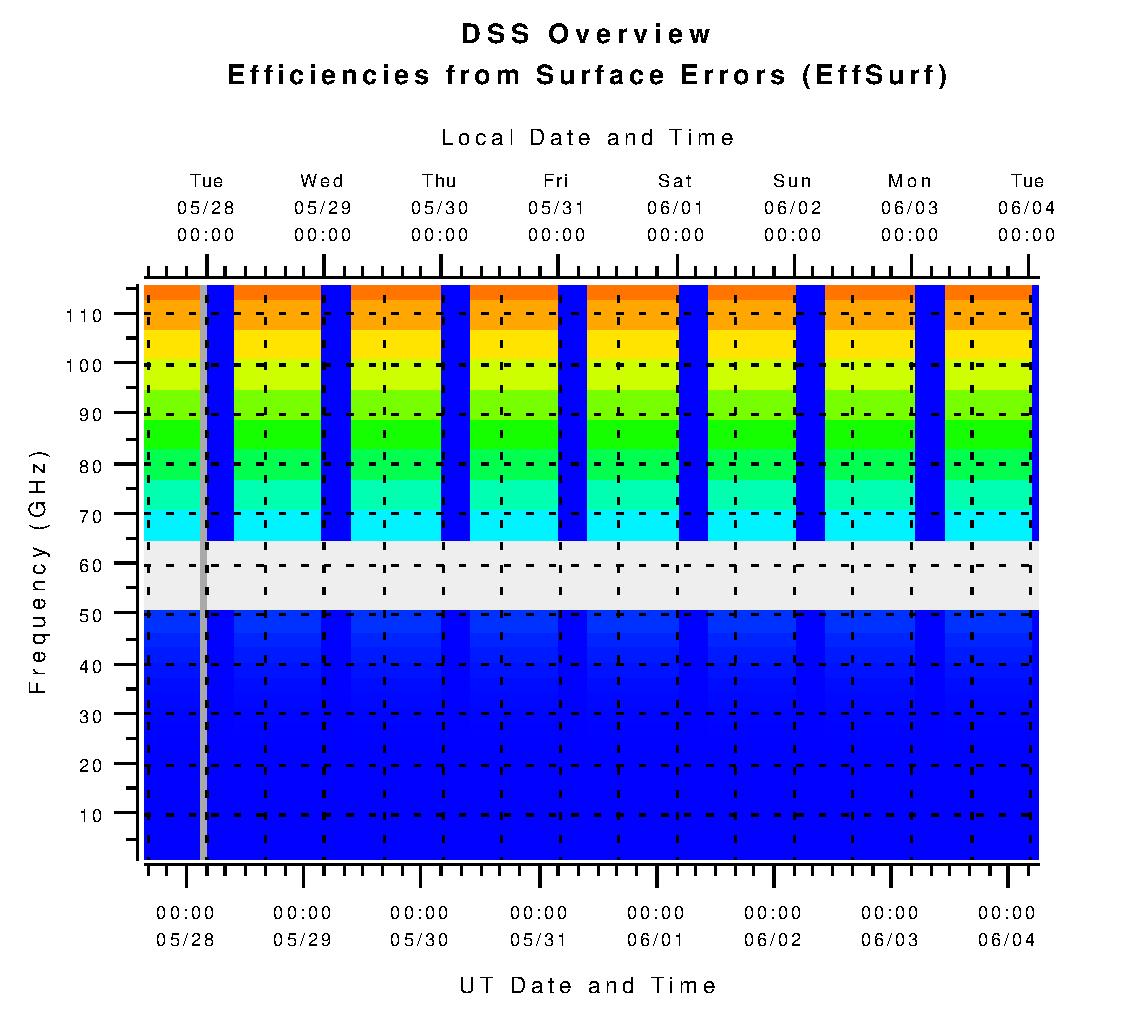
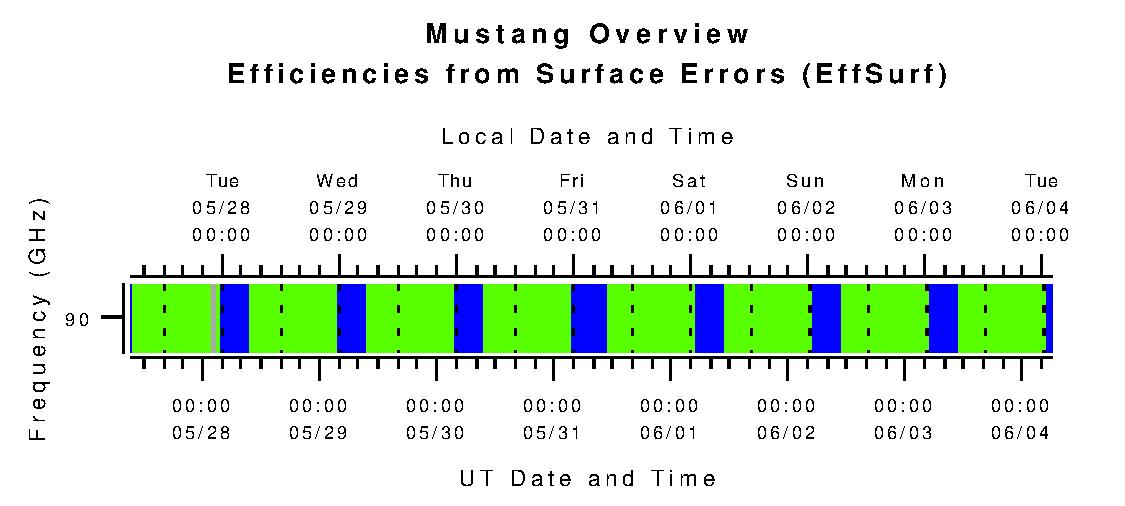
Explanation: Shows the degradation in the the part of efficiency that arises from surface errors due to daytime observing, relative to nighttime observing. |
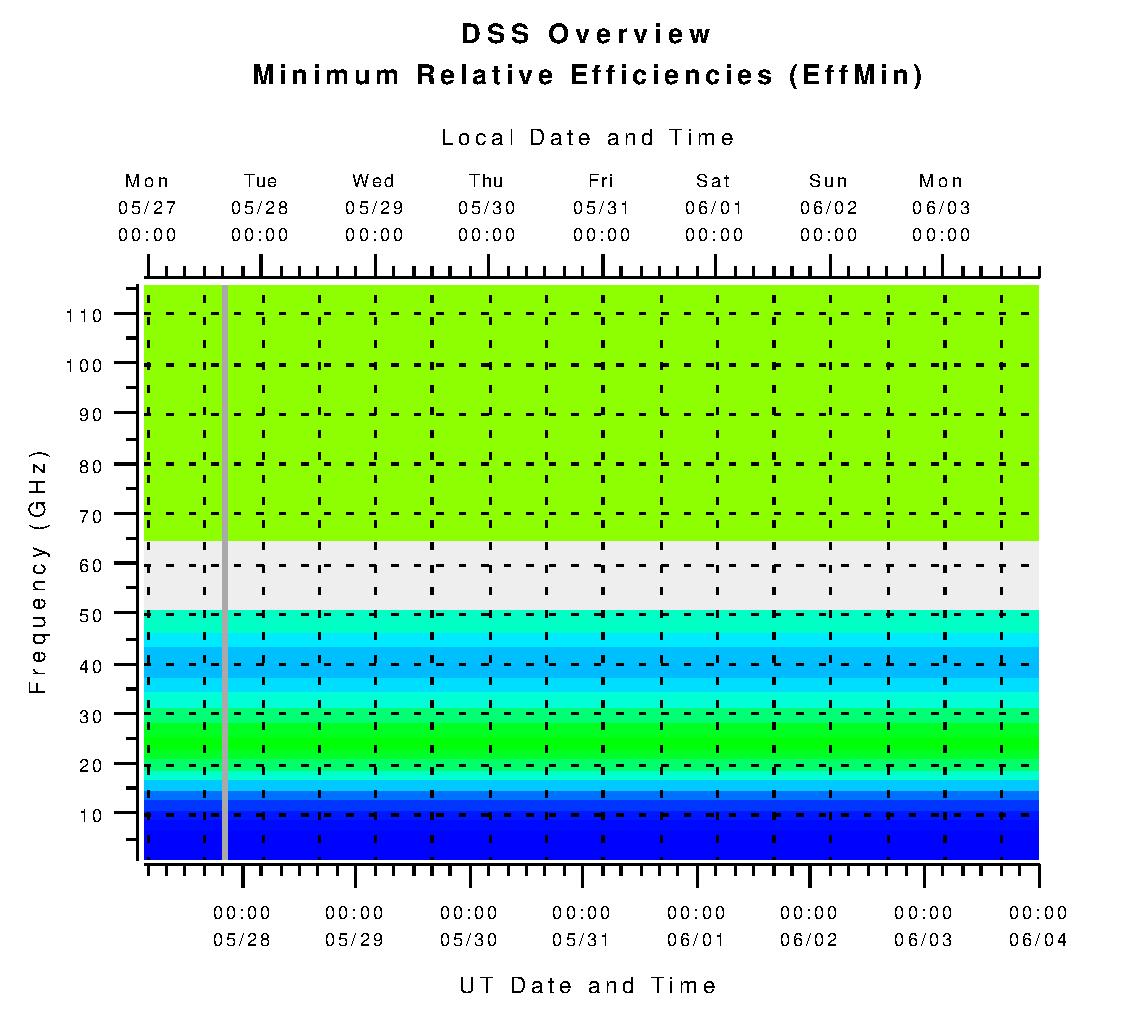
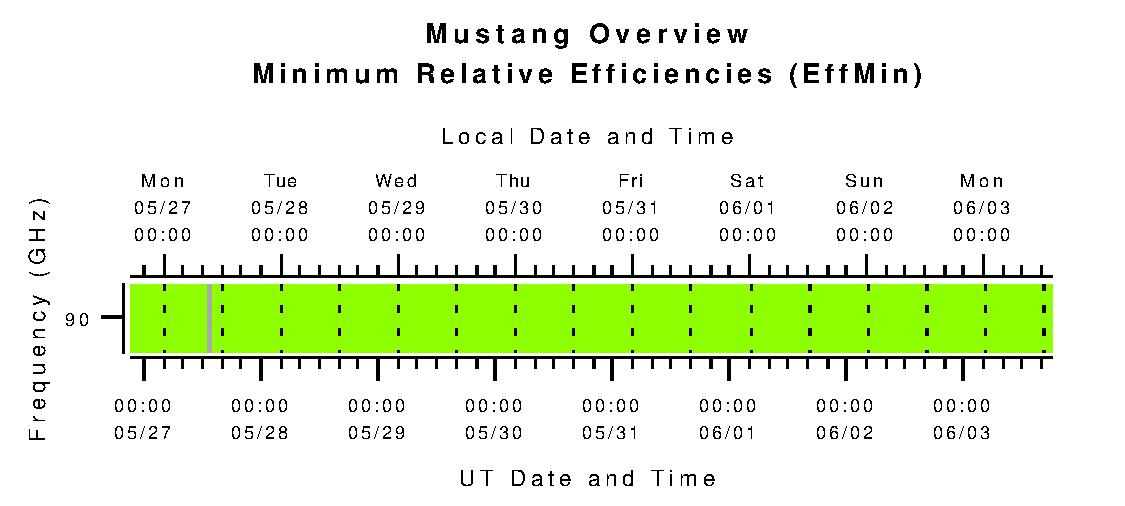
 |
Explanation: Indicates the minimum observing efficiency (Effs) for which the DSS judges that the science for a project will become futile. |
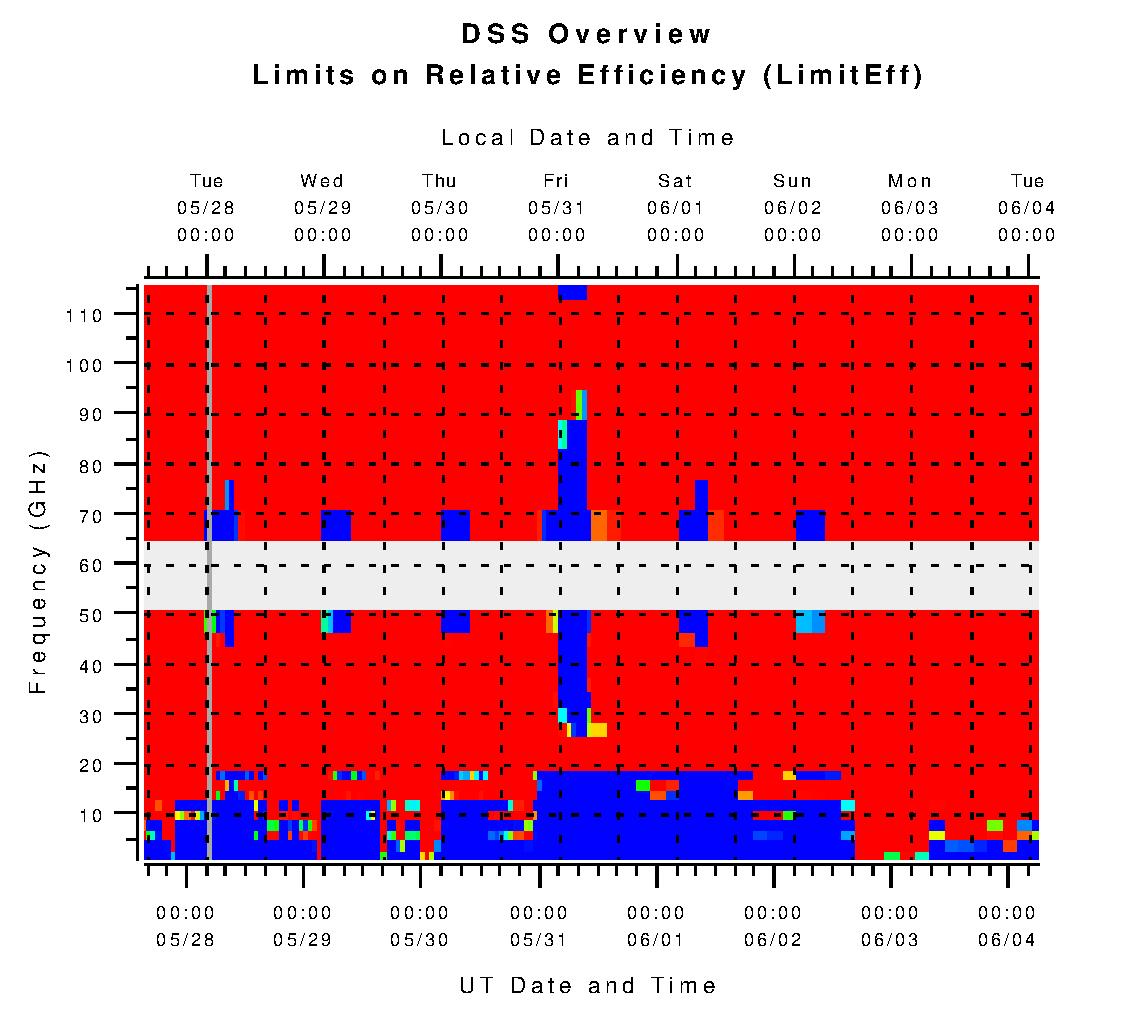
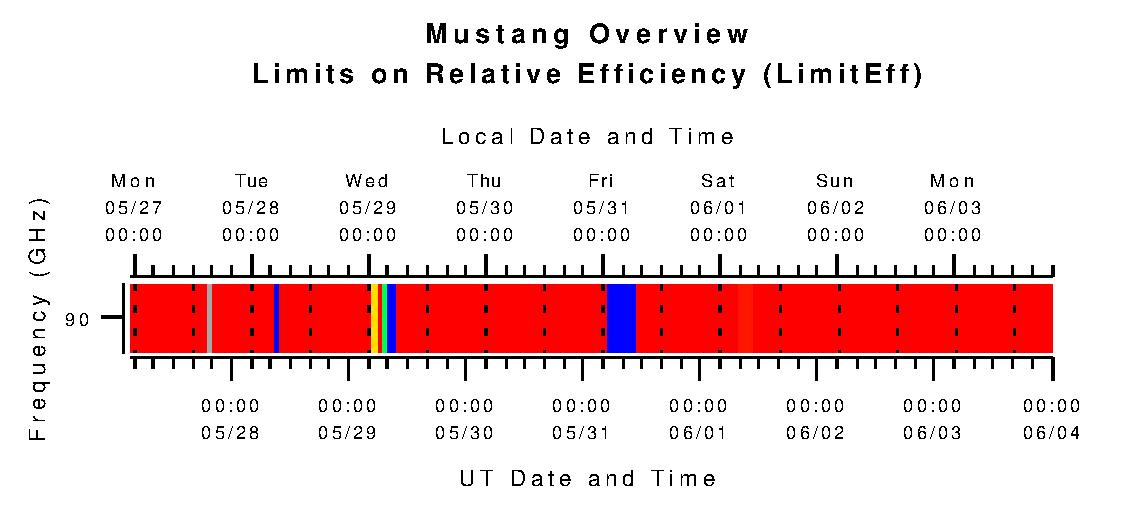
 |
Explanation: Indicates the penalty a project incurs for having an efficiency (Effs) below EffMin. |
 |
Explanation: Depicts a boolean that indicates when the estimated tracking and pointing errors will be large enough that the DSS judges that the science for a project will be futile. |
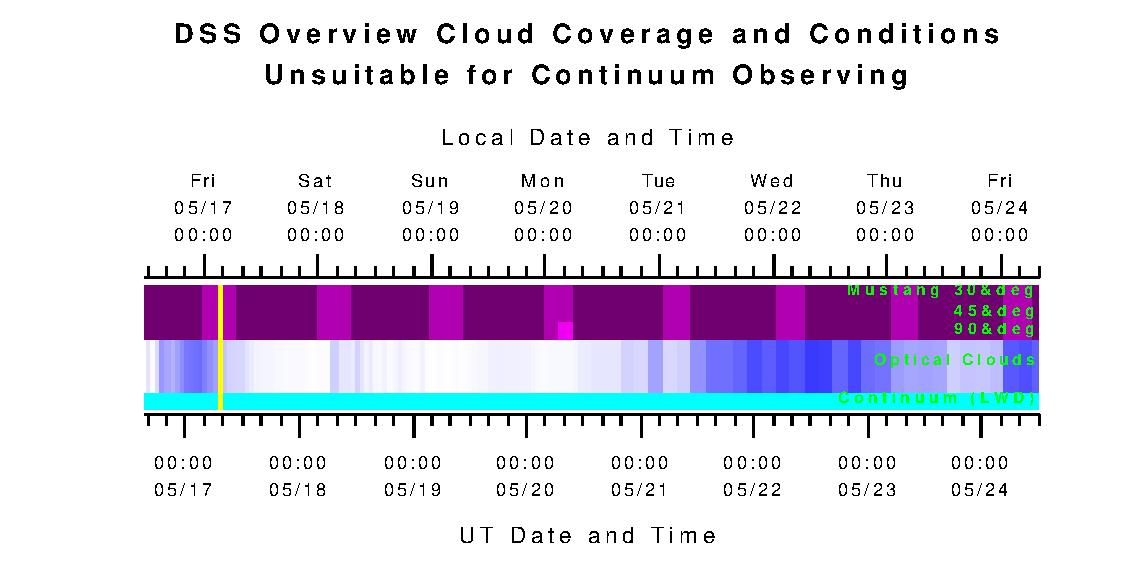
| Explanation: Shows the criteria for continuum observations, which have an additional
scoring factors based upon cloud coverage, the atmospheric
contributions to system temperature, and the IR irradiance from the sky. Various colors codes depict different aspects of cloud coverage and other criteria for scheduling continuum projects. In short, the times when conditions are best for continuum observing are those where blue extends from the top to the bottom of the figure. Any shade of white, cyan, or magenta indicate less than perfect continuum conditions. |
|
||||||||||||
|
Explanation:
|
|||||||||||