Table 1: IF Channels. The "Name" gives the labels that will identify these channels on the subsequent plots. The name is the beam designation (L1, R1, L2, R2, etc) and "_wide" for the wideband IFs from the IF Rack, or the center frequency for the 800 MHz channels. For example, "L4_25" means beam 4, left circular, 800 MHz band centered at 25 GHz.
| 18-22 GHz Receiever | 22-26 GHz Receiever | |||||||
|---|---|---|---|---|---|---|---|---|
| Name | DCR channel | Fcent|
| Name | DCR | channel Fcent | | ||
| L1_wide | 1 | 19.9 | 4200 | L3_wide | 2 | 24.2 | 4800 | |
| R1_wide | 3 | 19.9 | 4200 | R3_wide | 4 | 24.2 | 4800 | |
| L2_wide | 5 | 19.9 | 4200 | L4_wide | 6 | 24.2 | 4800 | |
| R2_wide | 7 | 19.9 | 4200 | R4_wide | 8 | 24.2 | 4800 | |
| L1_19 | 9 | 19.0 | 800 | L4_24 | 9 | 24.0 | 800 | |
| L1_20 | 10 | 20.0 | 800 | L4_25 | 10 | 25.0 | 800 | |
| L2_19 | 11 | 19.0 | 800 | L3_24 | 11 | 24.0 | 800 | |
| L2_20 | 12 | 20.0 | 800 | L3_25 | 12 | 25.0 | 800 | |
| R1_19 | 13 | 19.0 | 800 | R4_24 | 13 | 24.0 | 800 | |
| R1_20 | 14 | 20.0 | 800 | R4_25 | 14 | 25.0 | 800 | |
| R2_19 | 15 | 19.0 | 800 | R3_24 | 15 | 24.0 | 800 | |
| R2_20 | 16 | 20.0 | 800 | R3_25 | 16 | 25.0 | 800 | |
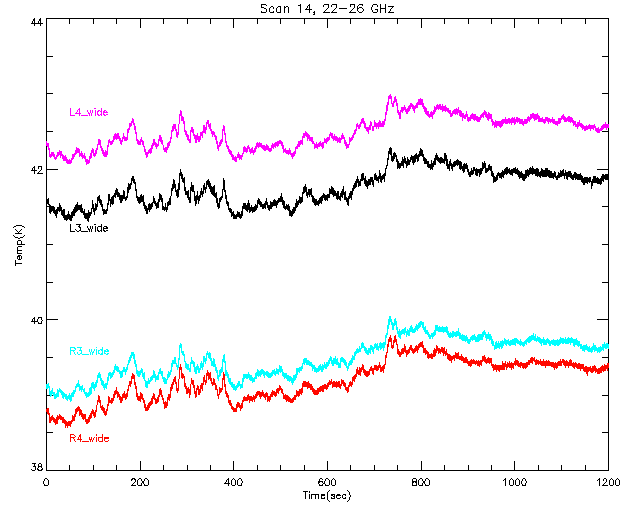
Figure 1. Wide-band channels, 22-26 GHz

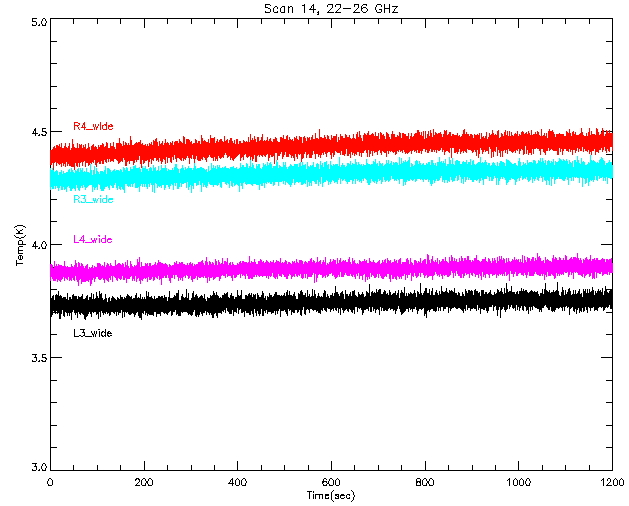
800 MHz channels, 22-26 GHz
Spectra have been shifted arbitrary amounts in Y, for clarity.
These are pretty much the same as the wide-band channels, but
the Y scale is different.
Figure 2. 800MHz channels, 22-26 GHz

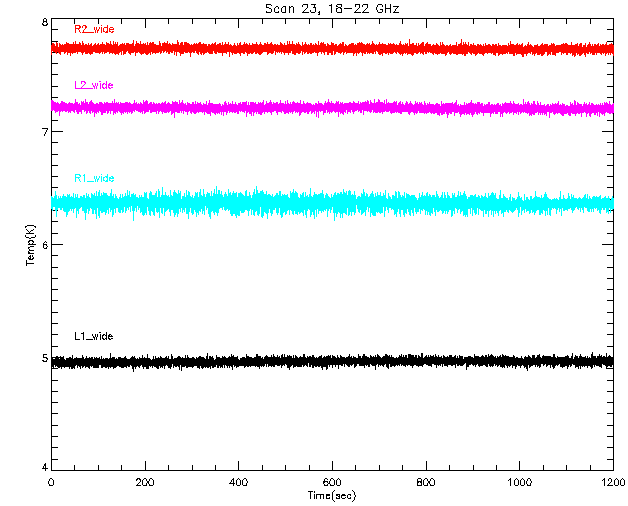
Figure 3. Wide-band channels, 18-22 GHz

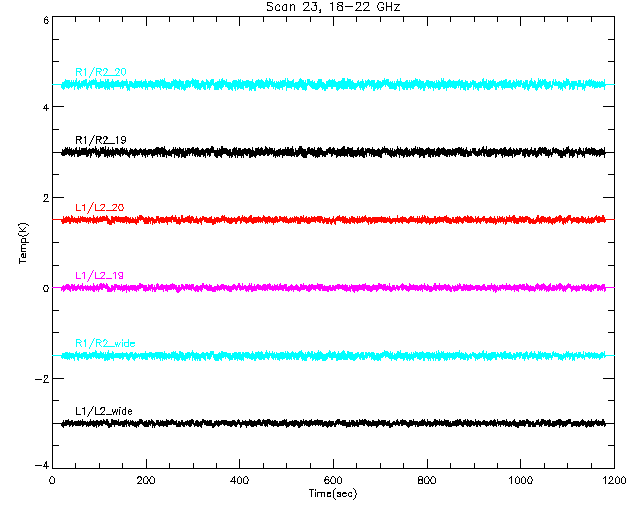
Figure 4. 800 MHz channels, 18-22 GHz

Again, spectra have been arbitrarily shifted in Y.
One may note a systematic drift in some channels over the 30 minute observaion.
Figure 5. Gain Fluctuations: 22-26 GHz (wideband)

The drift in the gain is characterized by taking the difference between an average of points at the beginning of the scan and at the end, then dividing by the average over the whole scan. This is shown in the "Drift" column in Table 2. The gain rms values ("Grms") are the rms over the scan after removing a 2nd order polynomial fit to the data. We would expect the rms noise to be about a factor of two lower for the 4 GHz bandwidth channel, but it isn't. As one can see from the table, the wideband channels have rms of about 16-20 milliKelvins for the 0.1 sec sample time, and the 800 MHz channels are about 30 mK.
The results for longer integration times were found by averaging the raw data over 1, 10, and 100 seconds and doing the same analysis that was done for the 0.1 sec data. The results are shown in Table 2. Similar operations were done for the low band receiver (18-22 GHz) and those results are shown below in Table 3.
One may compare these results with those from the January 8 data, we find the rms gain fluctuations much smaller, but still considerably larger than the prediction of the radiometer equation. The radiometer equation predictions are listed at the end of the table.
Table 2. Results for 22-26 GHz (scan #14).
 Channel  TCal    Tsys    Drift   ----------Grms(mK)---------------
           K       K       %      (0.1 s)  (1.0 s)  (10 s)  (100 s)
 L3_wide  3.74   41.76    0.630    18.85    5.72     2.71    1.91
 R3_wide  4.31   39.49    0.994    19.61    5.66     2.22    1.16
 L4_wide  3.89   42.49    0.706    16.49    4.93     2.16    1.48
 R4_wide  4.43   39.19    1.409    19.48    5.68     2.36    1.45
 L4_24    3.45   40.81    0.724    27.24    8.83     3.37    1.71
 L4_25    3.44   39.04    0.699    24.18    8.40     5.21    4.45
 L3_24    3.48   41.04    0.460    27.95    8.63     3.71    2.06
 L3_25    3.09   34.85    0.292    23.05    7.33     2.83    1.32
 R4_24    4.72   38.99    1.135    30.61    9.12     3.55    1.54
 R4_25    4.38   37.04   -0.371    26.34    8.11     3.17    1.18
 R3_24    4.39   44.08    0.701    29.81    9.01     3.76    2.37
 R3_25    4.02   34.89    0.482    23.16    7.27     3.05    1.68


 Predicted (bw=4800 MHz; Tsys=40)  1.7      0.5      0.2     0.05
 Predicted (bw=800 MHz;  Tsys=40)  4.1      1.3      0.4     0.13
|
Figure 6. Gain Fluctuations: 18-22 GHz (wideband)

Table 3. Results for 18-22 GHz (scan #23).
 Channel  TCal    Tsys    Drift   ----------Grms(mK)---------------
           K       K       %      (0.1 s)  (1.0 s)  (10 s)  (100 s)
 L1_wide  5.16   35.93    0.261    20.46    6.11     2.60    1.30
 R1_wide  5.37   37.94   -0.182    35.94   10.54     3.78    1.69
 L2_wide  5.21   35.74   -0.275    21.28    6.95     3.89    2.97
 R2_wide  4.73   39.05   -0.123    20.20    5.98     2.54    1.67
 L1_19    4.61   32.01   -0.362    19.67    6.24     2.71    1.77
 L1_20    5.89   32.30    0.063    20.67    7.41     4.36    3.19
 L2_19    4.64   32.22   -0.673    20.63    6.48     3.04    2.13
 L2_20    5.92   32.25   -0.647    21.76    7.57     4.57    3.32
 R1_19    6.62   38.65   -0.762    35.87   10.79     4.22    1.79
 R1_20    5.36   38.47   -1.015    37.32   11.12     4.40    2.11
 R2_19    5.86   26.13    0.249    20.95    7.10     3.85    2.61
 R2_20    3.17   24.37    0.536    19.54    6.01     2.57    1.35

 Predicted (bw=4200 MHz; Tsys=40)  1.8      0.4      0.2     0.06
 Predicted (bw=800 MHz;  Tsys=40)  4.1      1.3      0.4     0.13
|
Figure 7. Beam Ratios: 18-22 GHz

To remove these long-term drifts, we median-filtered the data and subtracted from the original, then deleted outliers beyond 3 sigma. (The median filter window was 1/30 of the scan duration). The result is a scan with flat baselines. The next plot shows these flattened scans. Arbitrary offsets have been added in Y so the plots are not all on top of each other.
Figure 8. Flattened Beam Ratios: 18-22 GHz

This table shows the RMS in each channel after dividing and flattening. The RMS is show for three cases integrating over 0.1, 1.0, and 10 seconds and doing the same processing after doing the integrating in each case.
|
Table 4. RMS for beam ratios, 18-22 GHz.
Channel      --------Trms(mK)-------------
             (0.1 s)  (1.0 s)  (10 s)
 L1/L2(wide)   30.46   19.67     9.20
 R1/R2(wide)   36.74   22.67    10.07
 L1/L2(19)     31.41   20.54    11.27
 L1/L2(20)     32.45   21.09    10.05
 R1/R2(19)     42.27   26.14    11.85
 R1/R2(20)     44.57   28.23    13.74
|
For 22-26 GHz band, divide beam 3 data by beam 4, then calculate the rms over after removing drift by a median filter, and removing outliers.
|
Table 5. RMS beam ratios, 22-26 GHz.
Channel      --------Trms(mK)-------------
             (0.1 s)  (1.0 s)  (10 s)
 L3/L4(wide)  27.22    18.93    9.25
 R3/R4(wide)  26.60    16.90    9.67
 L3/L4(24)    32.53    21.14   10.61
 L3/L4(25)    26.70    17.55    9.20
 R3/R4(24)    36.32    21.06   10.56
 R3/R4(25)    27.64    16.16    8.94
|
Figure 9. RMS vs Integration time: 18-22 GHz
